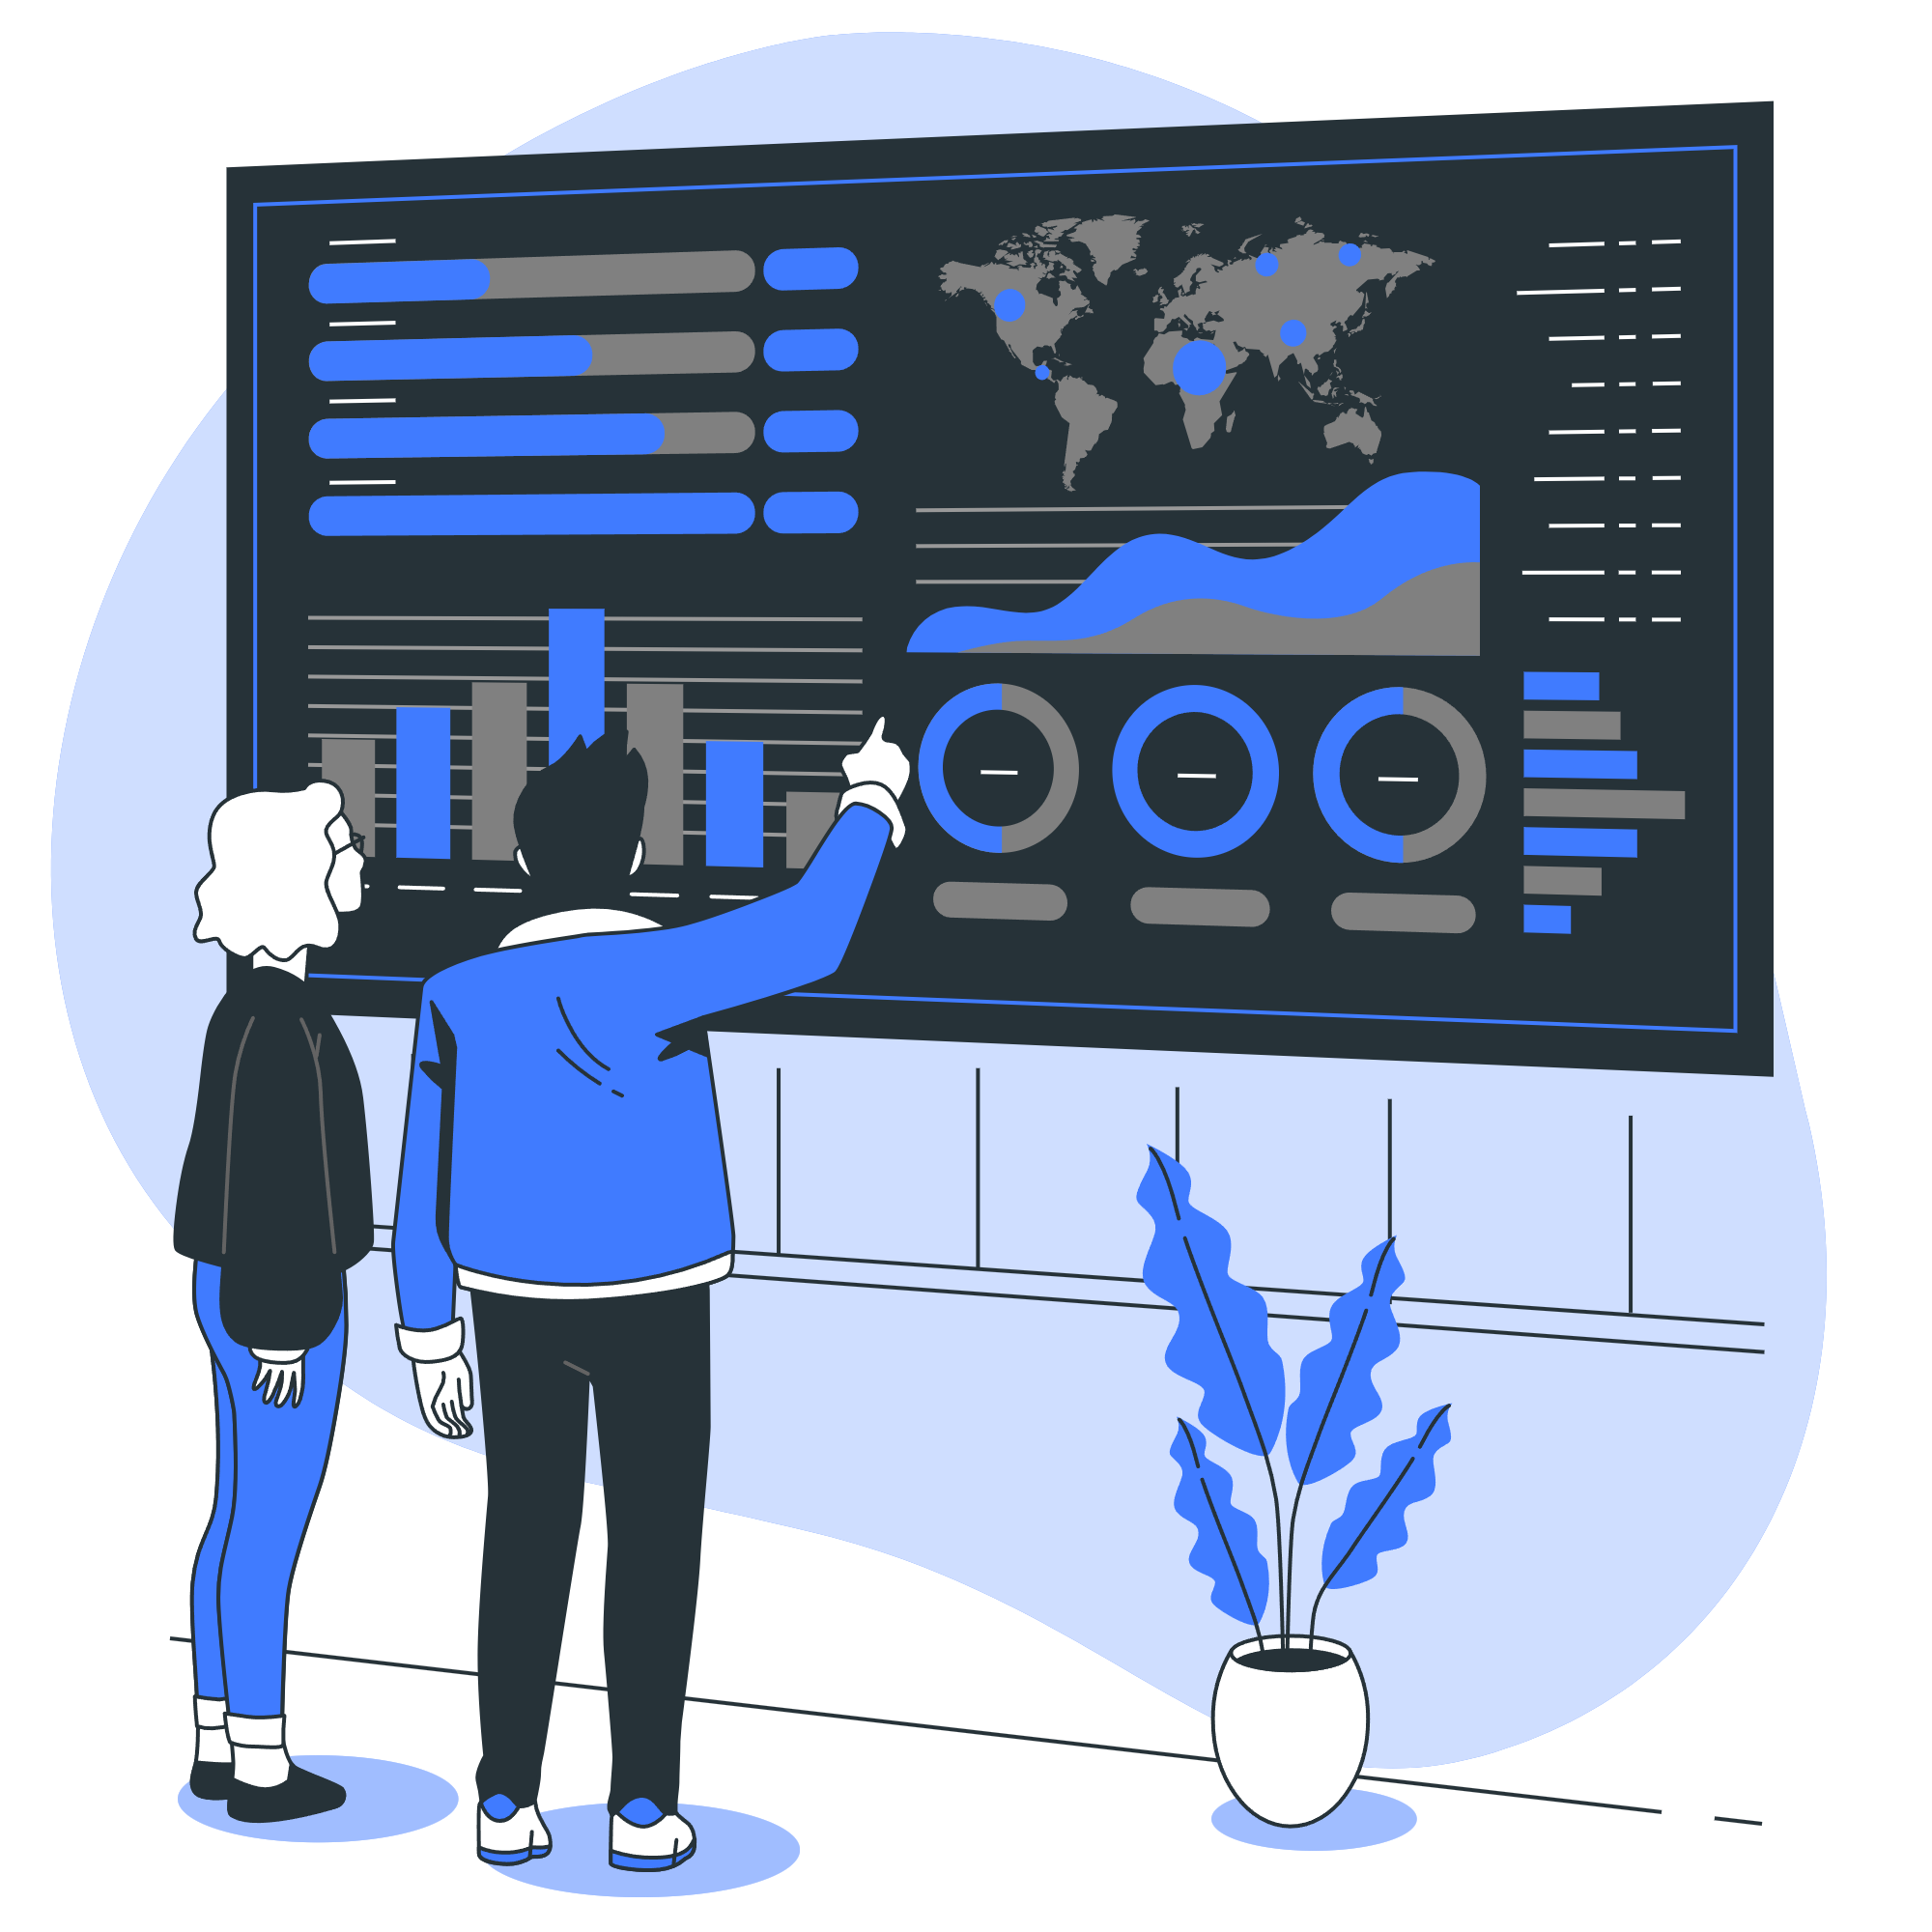
Data visualization is an essential component of data analysis, providing a clear, visual context to complex data sets. At Dataknacks, we specialize in turning your data into compelling visual narratives that enable stakeholders at all levels to understand and engage with the information. Our customized data visualization tools and dashboards are designed not just to present data, but to bring it to life, making it accessible, understandable, and actionable.
We harness the power of cutting-edge visualization technologies to create intuitive and interactive charts, graphs, and dashboards that reveal the hidden stories within your data.


The art and science of data visualization at Dataknacks go beyond mere graphical representation. We focus on creating visualizations that are not only aesthetically pleasing but also strategically insightful.
Explore our approach to designing bespoke visualizations that resonate with your brand and communicate your data's story effectively.
Learn about our interactive dashboards that provide real-time data insights, enabling dynamic decision-making.
Understand how we prioritize user experience in our visualizations, ensuring they are intuitive, engaging, and informative for all users.
Discover how we use infographics and data mapping to simplify complex information into easily digestible visual formats.